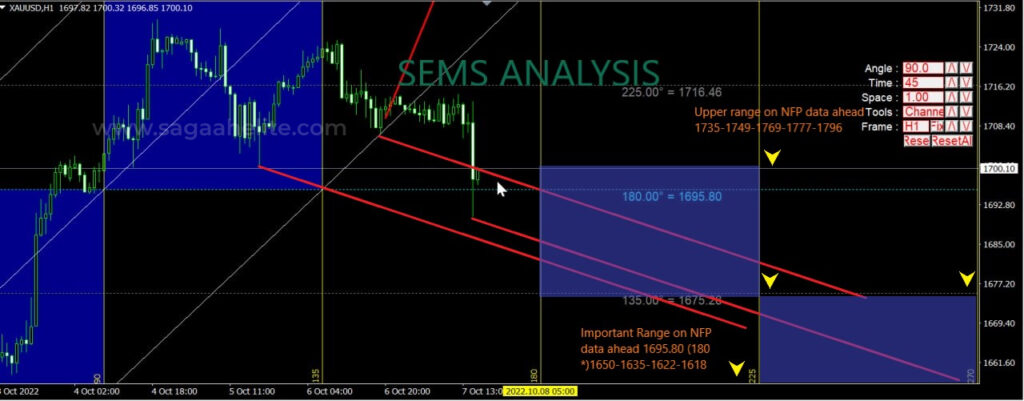
Scenario 1:
Analysis:
The price of gold has recently experienced a decrease from a major resistance level. A range has been formed, and there’s a possibility of a fake break of the range and resistance at 1725.
Expectation:
If the price does make a fake break, there may be a fall from the major resistance, aligning with the global bearish trend.
Goal:
Support level identified at 1687.52.
Scenario 2:
Analysis:
The price has broken through the range zone, updating the highs. A double top has been formed at the resistance level. The anticipation is that if the price tests the resistance zone again, it might lead to a fall in line with the global bearish trend.
Expectation:
A potential decline from the major resistance with a goal to support at 1694.95.
Scenario 3:
Analysis:
Similar to Scenario 2, the price has broken through the range zone and updated the highs. There’s a testing of the resistance and a global trendline, with a mention of a possible fake break.
Expectation:
A potential fall in the global bearish trend if the resistance zone is tested again.
Goal:
Support level identified at 1679.9.
Support and Resistance Levels:
Resistance Levels (R):
- R1: 1719
- R2: 1734
- R3: 1757
- R4: 1769
Support Levels (S):
- S1: 1695.80
- S2: 1675
- S3: 1650
- S4: 1635
Summary:
The overall analysis suggests a cautious approach, closely monitoring the behavior around the resistance levels. Given the emphasis on the global bearish trend, it’s important to be prepared for potential downside movements. Each scenario indicates a specific support level to watch, providing a roadmap for decision-making.
However, remember that market conditions can change rapidly, so staying informed and adapting to real-time developments is crucial for effective trading decisions. Always consider risk management strategies to safeguard against unexpected market movements.


