

Evaluation on the Daily Chart:
The conclusion of a corrective downturn is postulated as the fourth wave within a broader scale, giving rise to the emergence of the fifth wave on the XAUUSD daily chart.
On the H4 chart, the formation of the first wave of a smaller degree is evident, while a corrective downward movement is currently in progress as the second wave.
The H1 chart indicates the evolution of another wave, implying a potential continuation of the descent towards the 1900-1888 zone, extending further to 1882/1869/1850.
Critical Levels and Overview:
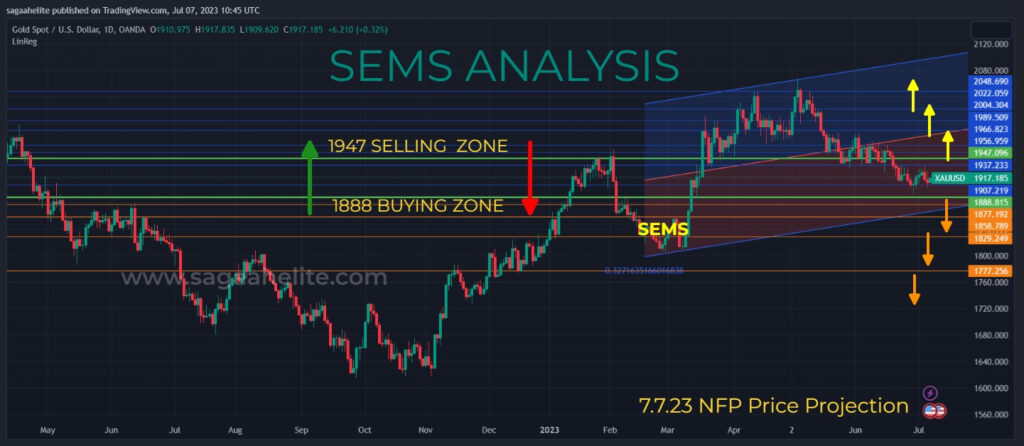
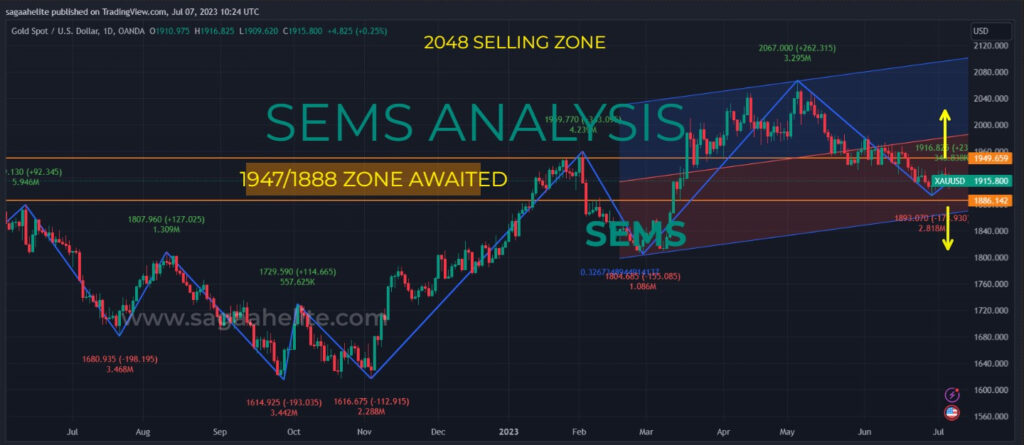
Significant levels encompass the 1951/1878 range, where the consideration of substantial lots may be relevant, encouraging the initiation of trades with moderate lots. A breach of yesterday’s high/low today could drive the price towards resistance levels at 1941/1972/1995, presenting opportunities for entering sell trades.
Conversely, breaking the low of June 29 at 1899 may induce a buy direction with small lots from levels 1895/1879/1859/1842, factoring in the NFP data.
Levels:
Beyond the 1940 range, key stops are positioned at 1957/1974/1999.
Below the 1890 range, major stops are noted at 1882/1871/1861/1847.
Zone of Caution:
A cautionary zone is identified at 1900-1921, advising against the utilization of substantial lots within this range.
Trading Zones and Quantities:
Sell Zones: 1930/1945 (restricted lots), 1948/1957 (intermediate lots), 1945/1969 (significant lots).
Buy Zones: 1910/1900 (intermediate lots), 1888/1875 (intermediate lots), 1870/1861 (significant lots).
Analysis of Momentum:
Downturn Momentum: $1904-1890-1859-1840-1830.
Upswing Momentum: $1952-1969-1992-2015-2038.
Risk Management:
Risk considerations align with individual capital and risk tolerance.
Caution is urged against accumulating multiple positions.
Factor in existing trades and broker margins.