

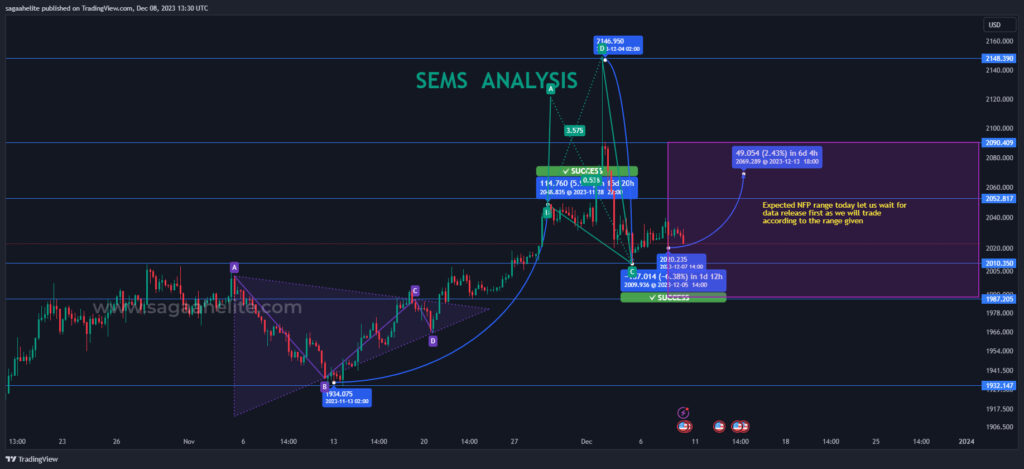
The current trajectory of gold prices remains characterized by a lateral movement, oscillating within the confines of a defined range. Market dynamics depict a recurrent alternation between upper and lower boundaries. Anticipating an accumulation phase within this range, my analysis envisions a potential descent to reevaluate the underlying support level, subsequently breaching the ascending channel. Noteworthy is the significance of lateral price movements at critical thresholds, suggesting an imminent downward trajectory with a retest of the pivotal support at 2000. Forecasts align with a specific support level residing at 2012.27.
Shifting focus to USDJPY, a substantial downturn unfolded in December 2023, witnessing a substantial 3.84% decline. The rapid descent transpired over a concise 15 trading hours, plummeting from 147.400 to 141.700. The aftermath anticipates a sustained dovish stance by the central bank to avert abrupt surges in bond yields. Contrary to assumptions linking Japanese policy to global rates, the analysis perceives minimal spill-over effects as Japan’s rates ascend. Noteworthy is the transient surge in the 10-year US Treasury yield, momentarily escalating by 7 basis points to 4.17%, only to retrace to 4.14%.
A subsequent narrative unfolds in the Treasury market, with a notable retreat of over 5 basis points in the 10-year Treasury yield, marking a nadir since early September. The US ISM Services PMI exceeded expectations, juxtaposed against a decline in JOLTS Job Openings to levels last seen in March 2021. Concurrently, productivity surged by 5.2%, surpassing both initial estimates and Dow Jones expectations at 4.7% and 4.9%, respectively. However, concerns arise from ADP data signaling a cooling job market, revealing an increase of 103,000 private payrolls in November, falling short of the Dow Jones estimate of 128,000.
Turning attention to the gold market, physically backed ETFs witnessed a modest outflow of US$920 million, a notable contraction compared to the preceding month. Holdings dwindled by 9 tonnes in November, reducing total AUM by 2% to US$212 billion, despite a 2% uptick in gold prices. North America, influenced by surging Treasury yields from June to October, experienced outflows amounting to (-US$9 billion), overshadowing inflows of US$4 billion during the remainder of the year.
Geopolitical tensions persist as potential catalysts, with the prospect of triggering an upward price rally ranging from $100 to $180 in Spot Gold. Additionally, considerations of low volumes influencing Monday’s early morning opening introduce another dimension to the market dynamics.
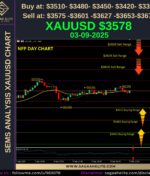
Resistance and support levels take shape as follows:
Support Levels (S):
- S1: 2011
- S2: 2001
- S3: 1990
- S4: 1985
- S5: 1970
Resistance Levels (R):
- R1: 2024
- R2: 2039
- R3: 2054
- R4: 2072
- R5: 2081