

Technical Analysis:
1. Support Test and Bullish Momentum:
The market recently tested a support level, and the price bounced off, indicating strength.
Currently heading towards the main resistance.
Updated highs and fixed above resistance, suggesting strong bullish momentum.
Anticipation of a potential upward move towards the next resistance level.
2. Range Breakout and Divergence:
The market broke out of a range zone and is approaching resistance after testing support.
Signs of losing momentum and divergence observed at the resistance level.
Possibility of a downside move, especially if there’s a fake break or a double top formation.
3. Fundamental Factors:
3.1: US Dollar Sell-Off:
Extra legs to the US Dollar sell-off after the Core PCE Price Index declined to 5% YoY in October.
Indicates signs of inflation cooling, supporting the recent dovish Federal Reserve pivot.
3.2 Near-Term Structural Influences:
Market outlook dependent on various factors, including FED policy, WGC ETF report, ongoing geopolitical tensions, Dollar strength, holiday season-based volumes, and China’s stance on COVID crisis management and reopening.
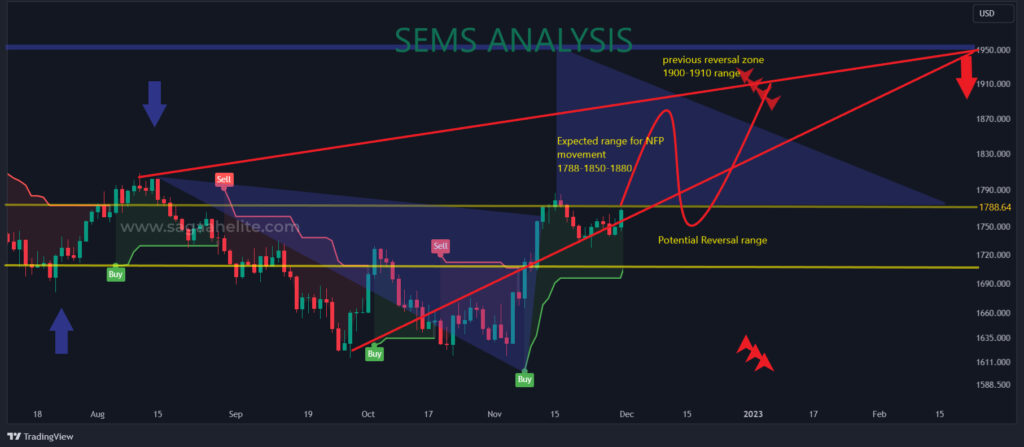
4. Potential Price Targets:
4.1: Bullish Momentum and Targets:
If bullish momentum takes Gold price upto 1809, potential targets will be evident i.e. 1824, 1838, 1848,1862.
Support and Resistance Levels:
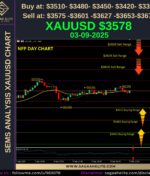
Resistance Levels (R):
- R1: 1775
- R2: 1815
- R3: 1855
- R4: 1882
- R5: 1902
Support Levels (S):
- S1: 1741
- S2: 1719
- S3: 1700
- S4: 1680
- S5: 1650
5. Conclusion:
The analysis provides a detailed assessment of the technical and fundamental factors influencing the gold market. Traders and investors should closely monitor key levels, especially the resistance and support zones, and stay informed about upcoming events that could impact market dynamics. The identified targets provide potential levels to watch for both bullish and bearish scenarios. As always, adaptability and risk management are crucial when navigating the complexities of financial markets.